EUR/USD
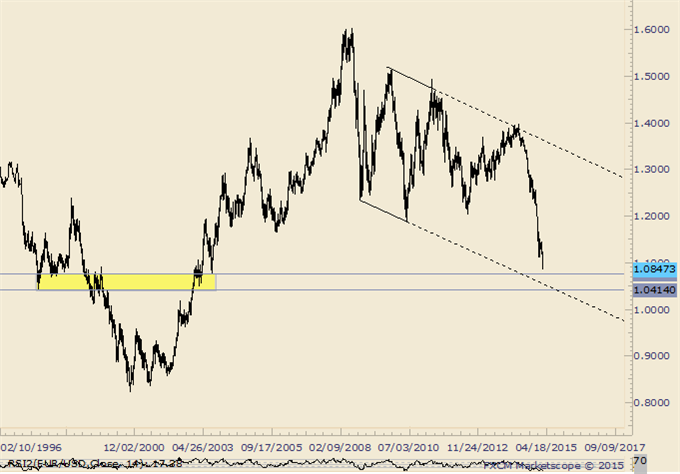
The euro trades in near-term consolidative phase above fresh low at 1.0821, posted in Asia. The price is for now entrenched within narrow range, with stronger bounce not ruled out as hourly / 4-hour studies are overextended. Daily / weekly close in long red candle maintains strong bearish tone, as daily indicators continue to point lower, despite oversold conditions. Consolidation above next targets at 1.0800 / 1.0762, psychological support / Sep 2003 low could be expected, with initial barrier at 1.0900 and more significant 1.0961, former low of 26 Jan and near 50% of 1.1112/1.0821 downleg, where corrective rallies should be ideally capped. Otherwise, daily close above here would signal stronger correction, with psychological 1.1000 barrier and 1.1031, last Friday’s high, to mark next resistances.
Res: 1.0900; 0.0961; 1.1000; 1.1031
Sup: 1.0821; 1.0800; 1.0762; 1.0700
The euro trades in near-term consolidative phase above fresh low at 1.0821, posted in Asia. The price is for now entrenched within narrow range, with stronger bounce not ruled out as hourly / 4-hour studies are overextended. Daily / weekly close in long red candle maintains strong bearish tone, as daily indicators continue to point lower, despite oversold conditions. Consolidation above next targets at 1.0800 / 1.0762, psychological support / Sep 2003 low could be expected, with initial barrier at 1.0900 and more significant 1.0961, former low of 26 Jan and near 50% of 1.1112/1.0821 downleg, where corrective rallies should be ideally capped. Otherwise, daily close above here would signal stronger correction, with psychological 1.1000 barrier and 1.1031, last Friday’s high, to mark next resistances.
Res: 1.0900; 0.0961; 1.1000; 1.1031
Sup: 1.0821; 1.0800; 1.0762; 1.0700

EUR/USD Hourly Chart
EUR/JPY
The pair accelerated weakness from 136.68, 12 Feb corrective top and broke below bear-channel’s lower boundary, to post fresh low at 130.69. As 131 handle was cracked, immediate focus remains at key short-term support at 130.13, 26 Jan low, for full retracement of 130.13/132.69 corrective phase and resumption of larger downtrend from 149.76, 2014 peak. Long red daily / weekly candles confirm strong bearish stance, with bounce on oversold near-term conditions to be ideally capped under 133 barrier, Fibonacci 38.2% retracement of 136.68/130.69 downleg.
Res: 131.85; 132.28; 132.72; 133.00
Sup: 131.00; 130.69; 130.13; 130.00

EUR/JPY Hourly Chart
GBP/USD
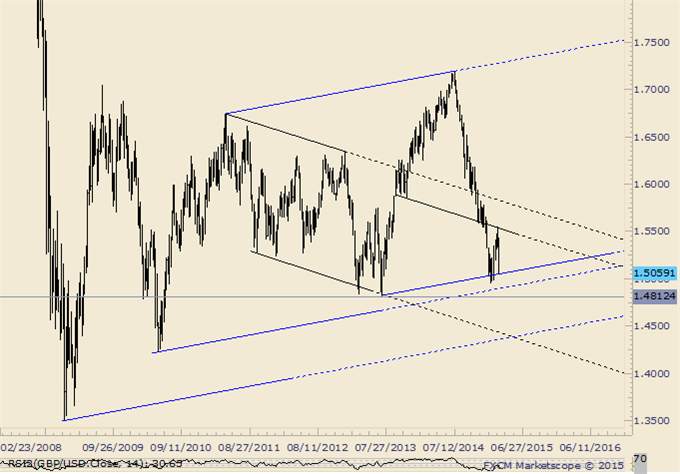
Cable approached psychological 1.5000 support, on last Friday’s acceleration lower that hit fresh low at 1.5030 and left long red candles on daily and weekly chart, signaling firm bearish tone and scope for full retracement of 1.4950/1.5551 rally. Corrective rally on oversold near-term studies faces initial barrier at 1.5100, round-figure resistance, ahead of 1.5184/94, daily Ichimoku cloud base / former higher base, where rallies should be ideally capped, before final push towards key med-term support at 1.4950, 23 Jan low. Only close above 1.5229/54 Fibonacci 38.2% of 1.5551/1.5030 downleg / last Friday’s high, would ease immediate downside pressure and allow for stronger correction.
Res: 1.5100; 1.5153; 1.5184; 1.5200
Sup: 1.5030; 1.5000; 1.4950; 1.4900

GBP/USD Hourly Chart
USD/JPY
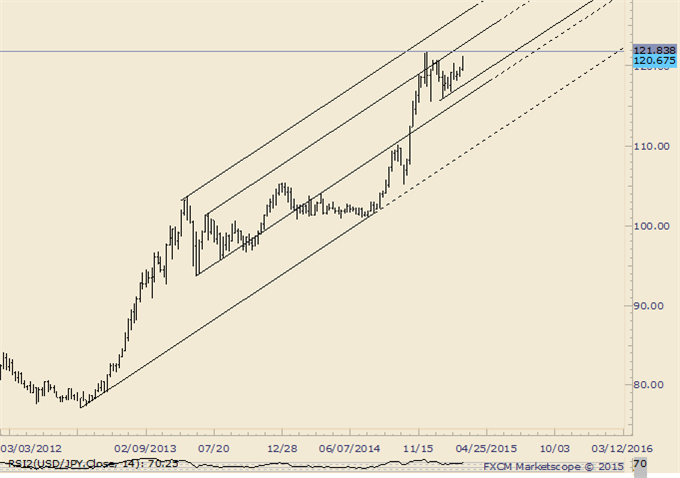
The pair maintains strong bullish tone, following last Friday’s acceleration higher that broke above 120.80/121 barriers and closed at 120.70, after leaving hourly higher base at 120.60. Near-term price action consolidates around 121 handle, with bullish setup of technicals, suggesting final push towards key med-term barrier at 121.83, peak of 08 Dec 2014. Initial supports at 120.60/46, session lows / 11Feb former high, are expected to hold and keep upside focused. Conversely, break here to signal further corrective action, with close below 120 support zone, also near Fibonacci 61.8% of 119.36/121.27 upleg, reinforced by daily Kijun-sen line, to sideline near-term bulls.
Res: 121.10; 121.27; 121.67; 121.83
Sup: 120.60; 120.46; 120.10; 119.90

USD/JPY Hourly Chart
AUD/USD
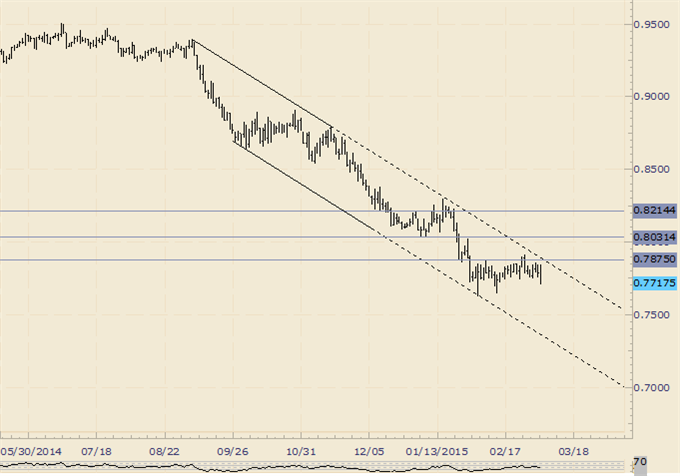
The pair maintains negative tone, after Friday’s weakness left long red candles on daily and weekly charts. Today’s probe below 0.77 handle, where near-term price action holds, suggests further easing and possible full retracement of 0.7624/0.7911 corrective rally. Asian trading was entrenched in tight Doji, showing limited upside attempts and keeping initial barrier at 0.7740, former base and Fibonacci 23.6% of 0.7911/0.7682 downleg, intact for now. Stronger rallies above here and 0.78 barrier, also 50% retracement, would ease immediate downside pressure and signal prolonged range-trading.
Res: 0.7740; 0.7770; 0.7800; 0.7858
Sup: 0.7700; 0.7682; 0.7642; 0.7624

AUD/USD Hourly Chart
AUD/NZD
The cross maintains positive near-term tone, as extended recovery rally from fresh low at 1.0279, broke and close above pivotal 1.0475 barrier, former lower tops of 24/25 Feb and Fibonacci 38.2% retracement of 1.0792/1.0279 descend. Positive close in past two days and weekly bullish engulfing candle, signal further corrective action, with sustained break above 1.05 barrier, to open 1.0535, 50% retracement of 1.0792/1.0279 descend and psychological 1.06 barrier, also Fibonacci 61.8%. Positive near-term technicals, with strong daily bullish momentum, support the notion, as the price cracked sideways-moving daily 55SMA and approaches the upper 20d Bollinger band. Consolidation here should be anticipated, as near-term studies are overbought, with corrective dips to be ideally contained above 1.0414/00 Fibonacci 38.2% of 1.0279/1.0498 rally / round-figure support, to keep bulls intact.
Res: 1.0498; 1.0535; 1.0596; 1.0631
Sup: 1.0453; 1.0414; 1.0400; 1.0380

AUD/NZD Hourly Chart
XAU/USD
Spot Gold resumed bear-leg off 1307 peak and fully retraced 1167/1307 rally. Daily / weekly close in long red candle and below 1167 level, confirms strong bearish stance for further easing and completion of larger 1131/1307 rally. Daily indicators have established in the negative territory and bearish setup of MA’s, support the notion. On the other side, oversold near-term studies see scope for corrective rally before fresh push lower. Fibonacci 38.2% of 1197/1163 downleg at 1176, marks initial resistance, ahead of 1180/84 , 50% and 61.8% retracement, with extended rallies to be capped under 1190, former base. Only close above 1200 barrier would neutralize bears for stronger correction.
Res: 1203; 1209; 1211; 1215
Sup: 1163; 1157; 1150; 1145

XAU/USD Hourly Chart