EUR/USD Wave analysis and forecast of 25.09 – 02.10: “Bearish” correction continues.
Estimated pivot point is at a level of 1.13.
Our opinion: Sell the pair from correction below the level of 1.13 with the target of 1.0930 – 1.09. In case of breakdown of the level of 1.13, buy with the target of 1.17
Alternative scenario: Breakout of the level of 1.13 and consolidation below this level will allow the rise in price up to 1.17.
Analysis: Presumably, the formation of the correction within the second wave 2 of the senior level continues, within which a double zigzag wxy is being formed. Locally, it is likely that the third wave y of 2 is being developed, within which, supposedly, the impetus as the wave (a) of y of 2 has completed. If this assumption is correct, following the upward correction (b) of y, the pair will continue to decline to the levels of 1.0930 - 1.09. Critical level for this scenario is 1.13. Breakout of this level will enable the price to continue to rise up to 1.17 - 1.20.
 GBP/USD Wave analysis and forecast of 25.09 – 02.10: Correction is nearing completion.
Estimated pivot point is at a level of 1.5064.
Our opinion: Wait for the completion of the fifth wave (v) and buy the pair at the breakdown of the level of 1.5064 with the target of 1.58 – 1.59.
Alternative scenario: Breakout and consolidation of the price below the level of 1.5064 will enable the pair to continue to decline to 1.49 – 1.48.
Analysis: Presumably, the formation of the senior level correction continues in the wave В of (2), which seems to take a shape of the irregular plane with the developing final wave c of B. Locally, it is likely that the diagonal in the wave с of B is being formed, within which the fifth final wave with the estimated level of 1.5060 is being formed. If this assumption is correct, it is possible that in the near future the price will reverse and start to rise in the wave С of (2).
 USD/CHF Wave analysis and forecast for 25.09 – 02.10: The decline in the pair is likely to continue.
Estimated pivot point is at a level of 0.99.
Our opinion: Sell the pair on the breakdown and below the level of 0.9664 with the target of 0.9130.
Alternative scenario: Breakout and consolidation of the price above the level of 0.99 will enable the pair to rise up to 1.0 – 1.10.
Analysis: Presumably, the formation of the wave C continues in the second 2 wave of the senior level. Locally, it seems that the correction as the second wave (ii) of the junior level is nearing completion and within it the wave c of (ii) is being developed. If this assumption is correct and the price does not break down the critical level of 0.99, the pair will continue to decline to the level of 0.9130 within the third wave (iii) of the estimated diagonal in the wave C. Breakdown of the level of 0.9664 will serve as a confirmation of the emerging wave (iii).
 USD/JPY Wave analysis and forecast of 25.09 – 02.10: Correction is nearing completion. The pair is likely to decline.
Estimated pivot point is at a level of 121.25.
Our opinion: Sell the pair from correction below the level of 121.25, or at the breakdown of the level of 119.20 with the target of 115.00 – 114.00.
Alternative scenario: Breakout and consolidation of the price above the level of 121.25 can trigger the rise in the up to the levels of 123.00 – 124.00.
Analysis: Presumably, the formation of the triangle within the wave of A of (4) of the estimated zigzag is nearing completion. Locally it is likely that the final wave (e) of b is close to completion. If this assumption is correct, the decline in the pair to the estimated target of 115.00 can resume. Critical level for this scenario is 121.25.
 USD/СAD Wave analysis and forecast of for 25.09 – 02.10: Uptrend in the pair has resumed.
Estimated pivot point is at a level of 1.3015.
Our opinion: Buy the pair from correction above the level of 1.3015 with the target of 1.35 – 1.3550.
Alternative scenario: Breakout and consolidation of the price below the level 1.3015 will enable the decline in the pair to 1.29 – 1.28.
Analysis: Presumably, the formation of the upward impetus in the third wave of the senior level (3) continues. Locally it is likely that the development of the as the fourth wave (4) has completed and the fifth wave is being developed, which, judging by the first wave (i), will be formed in the shape of a diagonal. If this assumption is correct, it is likely that the pair will continue to rise up to the levels of 1.35 – 1.3550. Critical level for this scenario is 1.3015. Breakdown of this level will trigger the decline in the pair to the levels of 1.29 – 1.28.


EUR/USD Wave analysis and forecast of 18.09 – 25.09: In the medium-term the pair is likely to grow.
Estimated pivot point is at a level of 1.1080.
Our opinion: Buy the pair from correction above the level of 1.1080 with the target of 1.1850 – 1.20.
Alternative scenario: Breakout of the level of 1.1080 and consolidation below this level will trigger further decline to 1.10 – 1.09 in the second wave.
Analysis: Presumably, the formation of the bearish correction as the second wave ii has completed in the third wave of the senior level. Locally, it is likely that the formation of the first one-two wave of the junior level (i) of iii of 3 is nearing completion. If this assumption is correct, after the local correction (ii) the pair will continue to rise to the levels of 1.1850 – 1.20. Critical level for this scenario is 1.1080. Breakout of this level will enable the price to go down to the levels of 1.10 – 1.09 within the second wave ii of 3.
 GBP/USD Wave analysis and forecast of 18.09 – 25.09: The pair is likely to grow.
Estimated pivot point is at a level of 1.5327.
Our opinion: Buy the pair from correction above the level of 1.5327 with the target of 1.5822 – 1.59.
Alternative scenario: Breakout and consolidation of the price below the level of 1.5327 allow the pair to continue to decline to the level of 1.52 – 1.51.
Analysis: Presumably, he formation of the senior level correction has completed in the wave X, which currently has a shape of a plane. Locally, it seems that the wave Y is being formed, within which one-two wave (i) has been formed in the shape of the wedge and correction (ii), as well as the third wave (iii) of a of Y. If this assumption is correct and the price does not break down the critical level of 1.5327, the pair will continue to rise up to 1.58.
 USD/CHF Wave analysis and forecast for 18.09 – 25.09: The pair is likely to decline.
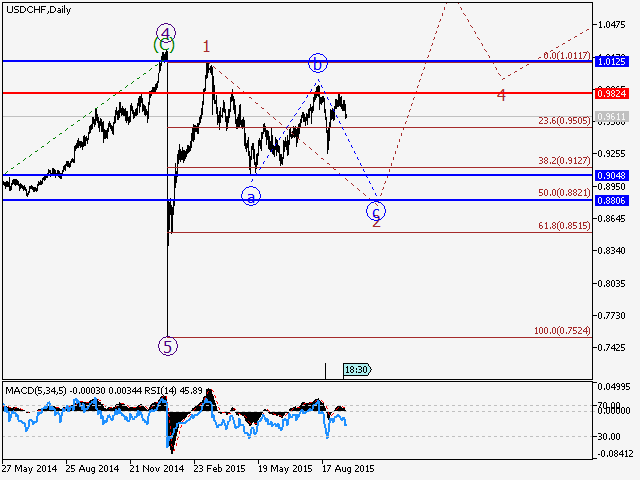
Estimated pivot point is at a level of 0.9824.
Our opinion: Sell the pair from correction below the level of 0.9824 with the target of  0.9130 – 0.9050. In case of breakdown of the level of 0.9824, buy the pair with the target of 1.0 – 1.10.
Alternative scenario: Breakout and consolidation of the price above the level of 0.9824 will enable the pair to rise up to 1.0 – 1.10.
Analysis: Presumably, the formation of the wave C continues in the second 2 wave of the senior level. Locally, it seems that the correction as the second wave (ii) of the junior level, which has a shape of a zigzag, has completed. If this assumption is correct, the pair will continue to decline to the levels of 0.9130 – 0.9050 in the third wave (iii) of the estimated diagonal in the wave C. предполагаемой диагонали в волне С. Critical level for this scenario is the local high of 0.9824.
 USD/JPY Wave analysis and forecast of 18.09 – 25.09: Correction has completed; the pair is likely to decline.
Estimated pivot point is at a level of 121.00.
Our opinion: Sell the pair from correction below the level of 121.00 with the target of 115.00 – 114.00.
Alternative scenario: Breakout and consolidation of the price above the level of 121.00 will allow the pair to continue growth up to 123.00 – 124.00.
Analysis: Presumably, the formation of the large “bearish” correction as the fourth wave (4), continues. Locally, it seems that the first wave A of (4) is being formed, in which the correction as the wave b of A (which has a shape of a triangle), has completed. If this assumption is correct, the pair will continue to decline to the levels of 115.00 – 114.00 in the wave c of A. Critical level for this scenario is 121.00.
 USD/СAD Wave analysis and forecast of for 18.09 – 25.09: The pair is likely to decline.
Estimated pivot point is at a level of 1.3320.
Our opinion: Sell the pair from correction below the level of 1.3320 with the target of 1.2935 – 1.28.
Alternative scenario: Breakout and consolidation of the price above the level of 1.3320 will allow the pair to continue growth up to 1.35.
Analysis: Presumably, the formation of the upward impetus in the third wave of the senior level (3) has completed. Locally it is likely that the development of the downward correction as the fourth wave (4) has begun. If this assumption is correct, it is likely that the pair will continue to decline to the levels of 1.2935 – 1.2470. Critical level for this scenario is 1.3320. Breakdown of this level will enable the pair to continue growth to the level of 1.35.

EUR/USD Wave analysis and forecast of 11.09 – 18.09: Correction is completed and the pair is expected to rise
Estimated pivot point is at a level of 1.1080.
Our opinion: Buy the pair from corrections above the level of 1.1080 with a target of 1.1850 – 1.20.
Alternative scenario: Breakout of the level 1.1080 and consolidation below will allow the pair to continue declining to levels 1.10 – 1.09 as part of the second wave.
Analysis: Supposedly, a bearish correction in a form of the second wave ii has stopped forming within the third wave 3 of senior level. Apparently, the first counter-trend wave f junior level (i) of iii of 3 is forming locally. If this assumption is correct, the pair will continue to grow to 1.1850 – 1.20. The level of 1.1080 is critical in this scenario as the breakout will enable the pair to continue declining as part of the second wave ii of 3 to the levels 1.10 – 1.09.
 GBP/USD Wave analysis and forecast of 11.09 – 18.09: The pair is expected to grow.
Estimated pivot point is at a level of 1.5160.
Our opinion: Buy the pair from corrections above the level of 1.5160 with a target of 1.5822 – 1.59.
Alternative scenario: Breakout and consolidation below the level of 1.5160 will allow the pair to continue declining to the levels of 1.50 – 1.49.
Analysis: Supposedly, a big correction of senior level stopped forming within the wave X, currently shaped like a plane. Apparently, the first wave is forming locally, with an impetus expected to develop to 1.58 within. The level of 1.5160 is critical in this scenario.
 USD/CHF Wave analysis and forecast for 11.09 – 18.09: The pair is expected to decline.
Estimated pivot point is at a level of 0.9820.
Our opinion: Sell the pair from corrections below the level of 0.9820 with a target at 0.9130 – 0.9050. Buy the pair with the target of 1.0 – 1.10 in case the level at 0.9820 is broken.
Alternative scenario: Breakout and consolidation above the level of 0.9820 will allow the pair to continue the rise up to the levels of 1.0 – 1.10.
Analysis: Supposedly, the wave C continues to form within the second wave (2) of senior level. Apparently, a correction in a form of the zigzag-shaped second wave (ii) of junior level is completed. If the assumption is correct, the pair will continue to drop to 0.9130 – 0.9050 as part of the third wave (iii) of an expected diagonal in the wave C. The local maximum level of 0.9820 is critical in this scenario.
 USD/JPY Wave analysis and forecast of 11.09 – 18.09: Correction is going on, pair still may fall.
Estimated pivot point is at a level of 125.25.
Our opinion: Sell the pair below the level of 125.25 with a target at 115.00 – 114.00.
Alternative scenario: Breakout and consolidation above the level of 125.25 will allow the pair to continue the rise up to the levels of 127.00 – 128.00.
Analysis: Apparently, a big bearish correction in a form of fourth wave (4) continues to develop. Apparently, the first wave A of (4) is forming locally, with an ascending correction in a form of wave b of A developing within. If the assumption is correct, once the wave (c) of b is completed, the pair would reverse at about 123.00 and continue dropping as part of wave c of A to the levels at 115.00 – 114.00. The level 125.25 is critical in this scenario.
 USD/СAD Wave analysis and forecast of for 11.09 – 18.09: The pair is expected to fall due to correction.
Estimated pivot point is at a level of 1.3320.
Our opinion: Sell the pair from corrections below the level of 1.3320 with a target at 1.2935.
Alternative scenario: Breakout and consolidation above the level of 1.3320 will allow the pair to continue rising to a level of 1.35.
Analysis: Supposedly, the formation of an ascending impetus within the third wave of senior level (3) is completed. Apparently, the pair is reversing at the moment. If the assumption is correct, the pair will logically continue to drop to a level of 1.2935. The level of 1.3320 is critical in this scenario as the breakout will make the pair continue rising to about 1.35.

EUR/USD Wave analysis and forecast of 04.09 – 11.09: Correction continues.
Estimated pivot point is at a level of 1.1250.
Our opinion: Buy the pair at the breakout of the level of 1.1250 with a target at 1.1850 – 1.20.
Alternative scenario: Breakout of the level 1.1250 and consolidation above will allow the pair to continue the rise up to levels 1.1850 – 1.20.
Analysis: A bearish correction in a form of the second wave ii within the third wave of senior level 3 is supposed to continue forming. Apparently, the wave (c) is forming locally, with an impetus targeted at about 1.10 developing within. If the presumption is correct, after correction, the pair will continue to grow to the levels 1.1850 – 1.20. The level of 1.1250 is critical in this scenario as the breakout would confirm the completion of correction and allow the pair to continue growing.
 GBP/USD Wave analysis and forecast of 04.09 – 11.09: Downward correction is nearing completion.
Estimated pivot point is at a level of 1.5438.
Our opinion: Buy with a target at 1.5822 once the level of 1.5438 is broken.
Alternative scenario: Breakout and consolidation above the level of 1.5438 will allow the pair to continue the rise up to the levels of 1.58 – 1.60.
Analysis: A big correction of senior level is supposed to be nearing completion within the wave X, currently shaped like a plane. Apparently, an impetus is forming locally, within the wave c of X, with the third wave of junior level (iii) completed inside. If the assumption is correct, the pair would continue declining to the levels 1.52 – 1.5180. The level of 1.5438 is critical in this scenario as the breakout will confirm the completion of correction.
 USD/CHF Wave analysis and forecast for 04.09 – 11.09: The pair is expected to decline.
Estimated pivot point is at a level of 0.9896.
Our opinion: Sell the pair from corrections below the level of 0.9896 with a target at 0.9130 – 0.9050. Buy the pair with a target of 1.0 – 1.10 in case the level at 0.9896 is broken.
Alternative scenario: Breakdown and consolidation above the level of 0.9896 will allow the pair to continue the rise up to the levels of 1.0 – 1.10.
Analysis: Supposedly, the wave C continues to form within the second wave (2) of senior level . Apparently, the first wave (i) has been formed locally as a zigzag, and the correction in a form of the second wave (ii) is nearing completion. If the assumption is correct, the pair will continue declining to the levels 0.9130 – 0.9050 as part of the third wave (iii) of a prospective diagonal in the wave C. The local maximum level at 0.9896 is critical in this scenario.
 USD/JPY Wave analysis and forecast of 04.09 – 11.09: The pair is expected to decline.
Estimated pivot point is at a level of 120.75.
Our opinion: Sell the pair below the level of 120.75. with a target at 115.00 – 114.00.
Alternative scenario: Breakout and consolidation above the level of 120.75 will allow the pair to continue the rise up to the levels of 124.00 – 125.00.
Analysis: Apparently, a big bearish correction in a form of the fourth wave (4) continues to develop. Apparently, the first wave А of (4) is forming locally, and a zigzag is expected to form within. If the assumption is correct, the pair would continue declining in the wave c of A to about 115.00. The level of 120.75 is critical in this scenario.
 USD/СAD Wave analysis and forecast of for 04.09 – 11.09: The pair is expected to fall due to correction.
Estimated pivot point is at a level of 1.3324.
Our opinion: Sell the pair from corrections below the level of 1.3324 with a target at 1.2935.
Alternative scenario: Breakout and consolidation above the level of 1.3324 will allow the pair to continue rising to a level of 1.35.
Analysis: Supposedly, the formation of an ascending impetus within the third wave of senior level (3) is completed. Apparently, a small counter-trend impetus in a form of the first wave (i) is forming locally. If the presumption is correct, the pair will logically continue to drop to a level of 1.2935. The level of 1.3324 is critical in this scenario as the breakout will make the pair grow further to about 1.35.