EUR/USD Wave analysis and forecast for 30.10 – 06.11: The pair is likely to rise.
Estimated pivot point is at a level of 1.0890.
Our opinion: Buy the pair from correction above the level of 1.0890 with the target of 1.15.
Alternative scenario: Breakout and consolidation of the price below the level of 1.0890 will enable the pair to continue decline to 1.08 – 1.07.
Analysis: Presumably, the formation of the correction, as the second wave 2 of the senior level in the shape of the plane qbc, has completed. Locally it is likely that the “bearish” impetus has completed in the wave c of 2. If this assumption is correct, the pair can rise to the level of 1.15 in the one-two wave of the junior level. Critical level for this scenario is 1.0890.
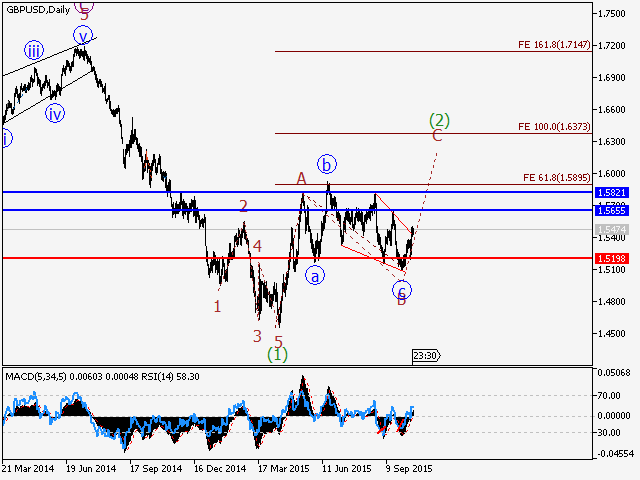
 GBP/USD Wave analysis and forecast for 30.10 – 06.11: The pair is likely to grow.
Estimated pivot point is at a level of 1.5100.
Our opinion: Buy the pair from correction above the level 1.5100 with the target of 1.56 – 1.58.
Alternative scenario: Breakout and consolidation of the price below the level of .5100 will enable the pair to continue decline to 1.50 – 1.4950.
Analysis: Presumably, the formation of wave С of 2 of the senior level continues. Within this wave the one-two wave (i), in the shape of the wedge, has completed, as well as the “bearish” correction as the wave (ii). If this assumption is correct, the pair will continue to grow up to the levels of 1.56 – 1.58. Critical level for this scenario is 1.5100.
 USD/CHF Wave analysis and forecast for 30.10 – 06.11: The pair is likely to decline.
Estimated pivot point is at a level of 0.9813.
Our opinion: Sell the pair after breakdown and consolidation below the level of 0.9813 with the target of 0.9470.
Alternative scenario: The rise in the pair up to 1.00 in the wave В.
Analysis: On the daily timeframe a long-term correction in the second wave 2 is being formed. At the moment, it seems that the pair has resumed the rise in the final wave (с) in the double triple wxy, within the wave В of 2 of the senior level. If this assumption is correct, after breakdown of the level of 0.9813 the pair will start to decline to the level of 0.95 in the wave С оf 2.
 USD/JPY Wave analysis and forecast for 30.10 – 06.11: Short-term uptrend continues.
Estimated pivot point is at a level of 120.00.
Our opinion: Buy the pair from correction above the level of 120.00 with the target of 123.25. In case of breakdown of the level of 120.00, sell with the target of 117.00 – 116.00.
Alternative scenario: Breakout and consolidation of the price below the level of 120.00 will enable the pair to continue decline to the levels of 117.00 – 116.00.
Analysis: Presumably, the formation of the large bearish correction as the fourth wave (4) continues. At the moment, it seems that the wave B is being formed, within which the wave of the junior level c of B of (4) is developing. If this assumption is correct and the price does not break down the critical level of 120.00, the pair can continue to rise up to the level of 123.25.
 USD/СAD Wave analysis and forecast for 30.10 – 06.11: The pair is likely to decline.
Estimated pivot point is at a level of 1.3278.
Our opinion: Sell the pair from correction below the level of 1.3278 with the target of 1.2710.
Alternative scenario: Breakout and consolidation of the price above the level of 1.3278 will enable the pair to continue the rise up to the levels of 1.34 - 1.3650.
Analysis: The formation of the large “bearish” correction continues, as the fourth wave (4). At the moment it is likely that the wave А of (4) is being formed as a zigzag, in which the correction as the wave x seems to be completing. If this assumption is correct, the pair will continue to decline to the level of 1.2710 in the wave y of A. Critical level for this scenario is 1.3278. Breakdown of this level will trigger the rise in the pair up to 1.34 – 1.3650.

Estimated pivot point is at a level of 1.1380.
Our opinion: In the short-term: sell the pair from correction below the level of 1.1380 with the target of 1.10. In the medium-term: wait for the completion of the correction and buy the pair with the targets of 1.17 – 1.20.
Alternative scenario: Breakout and consolidation of the price above the level of 1.1380 will enable the pair to continue to rise up to1.17.
Analysis: The formation of the correction as the wave 2 of the senior level continues and within it the wave c of 2 is being developed. Locally it is likely that the “bearish” impetus is being developed, within which the third wave (iii) has completed. If this assumption is correct, after the completion of the local correction (iv), the pair will continue to decline to the levels of 1.1050 – 1.10. Critical level for this scenario is 1.1380.
 GBP/USD Wave analysis and forecast for 23.10 – 30.10: Uptrend continues.
Estimated pivot point is at a level of 1.5100.
Our opinion: Buy the pair from correction above the level 1.5100 with the target of 1.56 – 1.58.
Alternative scenario: Breakout and consolidation of the price below the level of 1.5100 will enable the pair to continue to decline to 1.50.
Analysis: Presumably, the formation of first wave (i) continues in the expected upward impetus in the wave С of 2 of the senior level. Locally, it seems that the correction in the wave iv of (i) has completed, and if this assumption is correct, the pair will continue to rise up to 1.5580 – 1.5640 in the fifth wave v of (i). After that a deeper correction is possible as the wave (ii). Critical level for this scenario is 1.51.
 USD/CHF Wave analysis and forecast for 23.10 – 30.10: The pair is likely to decline.
Estimated pivot point is at a level of 0.9840.
Our opinion: Sell the pair below the level of 0.9840 with the target of 0.9245. In case of breakdown of the level of 0.9840, buy with the target of 1.0130.
Alternative scenario: Breakout and consolidation of the price above the level of 0.9840 will enable the pair to rise up to 1.0 – 1.0130.
Analysis: Presupposed earlier scenario of the formation of the wave C within the second wave 2 of the senior level is still possible. Locally, it is likely that the third wave of the junior level (iii) is being developed, within which the “bullish” correction as the wave ii of (iii) is nearing completion. If this assumption is correct and the price does not break down critical level of 0.9840, the pair will continue to decline to the level of 0.9245.
 USD/JPY Wave analysis and forecast for 23.10 – 30.10: Growth in the pair will resume.
Estimated pivot point is at a level of 118.00.
Our opinion: Buy the pair from correction above the level of 118.00 with the target of 123.25.
Alternative scenario: Breakout and consolidation of the price below the level of 118.00 will allow the pair to decline to 116.00 – 115.00.
Analysis: Presumably, the formation of the large “bearish” correction as the fourth wave (4) continues. Currently, it is likely that the wave B is being formed, within which the wave c of B of (4) of the junior level is being developed. If this assumption is correct and the price does not break down the critical level of 118.00, the pair can continue to rise up to the level of 123.25.
 USD/СAD Wave analysis and forecast for 23.10 – 30.10: The pair is likely to decline.
Estimated pivot point is at a level of 1.3460.
Our opinion: Sell the pair from correction below the level of 1.3460 with the target of 1.2685.
Alternative scenario: Breakout and consolidation of the price above the level of 1.3460 will enable the pair to continue to rise to the level of 1.3650.
Analysis: The formation of the large “bearish” correction, as the fourth wave (4), continues. At the moment it is assumed that the wave А of (4) is being formed as a zigzag, and it seems that correction is being developed within it, as the wave b. If this assumption is correct, after the completion of the correction the pair will continue to decline to the level of 1.2685 within the wave c of A. Critical level for this scenario is 1.3460. Breakdown of this level will trigger the rise in the pair up to 1.36 – 1.37.

EUR/USD Wave analysis and forecast for 16.10 – 23.10: The pair is likely to decline.
Estimated pivot point is at a level of 1.1500.
Our opinion: Sell the pair from correction below the level of 1.1500 with the target of 1.1050. In case of breakdown of the level of 1.1500, buy the pair with the target of 1.17.
Alternative scenario: Breakout and consolidation of the price above the level of 1.1500 will enable the pair to continue to rise up to1.17.
Analysis: Presumably, the formation of the correction as the second wave 2 of the senior level continues. Locally, it is likely that the formation of the wave b of 2 has completed and downtrend in the wave c of 2 is being developed. If this assumption is correct and the price does not break down the critical level of 1.15, the pair will continue to decline to the level of 1.1050 – 1.10.
 GBP/USD Wave analysis and forecast for 16.10 – 23.10: Uptrend continues.
Estimated pivot point is at a level of 1.5200.
Our opinion: Buy the pair from correction above the level 1.5200 with the target of 1.57 – 1.58.
Alternative scenario: Breakout and consolidation of the price below the level of 1.5200 will enable the pair to continue to decline to 1.51.
Analysis: Presumably, the formation of the correction of the senior level has completed in the wave В of (2), which took a shape of the irregular plane with the diagonal triangle (KDT) in the wave c of B. Locally, it is likely that the one two wave (i) is being developed, which has taken a shape of the extending diagonal triangle. If this assumption is correct, after the completion of the local correction the pair will continue to rise to the level of 1.60 – 1.63 in the wave С of (2). Critical level for this scenario is 1.51.
 USD/CHF Wave analysis and forecast for 16.10 – 23.10: The decline in the pair is likely to continue.
Estimated pivot point is at a level of 0.9840.
Our opinion: Sell the pair below the level of 0.9840 with the target of 0.9245. In case of breakdown of the level of 0.9840, buy with the target of 1.0130.
Alternative scenario: Breakout and consolidation of the price above the level of 0.9840 will enable the pair to rise up to 1.0 – 1.0130.
Analysis: Presumably, the formation of the wave C continues in the second 2 wave of the senior level. Locally, it seems that the correction as the second wave (ii) of the junior level has completed and the wave (iii) is being developed. If this assumption is correct and the price does not break down the critical level of 0.9840, the pair will continue to decline to the level of 0.9245.
 USD/JPY Wave analysis and forecast for 16.10 – 23.10: The decline in the pair will continue.
Estimated pivot point is at a level of 120.35.
Our opinion: Sell the pair from correction below the level of 120.35 with the target of 115.00 – 114.00. In case of breakdown of the level of 120.35, buy with the target of 122.00.
Alternative scenario: Breakout and consolidation of the price above the level of 120.35 will make possible the rise in the pair up to the levels of 122.00 – 124.00.
Analysis: Presumably, the formation of the triangle within the wave b of A of (4) of the estimated zigzag has completed. Locally it is likely that the wave с of А is being developed, within which the third wave (iii) is being formed. If this assumption is correct and the price does not break down the critical level of 120.35 the pair can continue to decline to the level of 115.00.
 USD/СAD Wave analysis and forecast for 16.10 – 23.10: The decline as part of the correction is likely to continue.
Estimated pivot point is at a level of 1.3074.
Our opinion: Sell the pair from correction below the level of 1.3074 with the target of 1.2485. In case of breakdown of the level of 1.3074 buy the pair with the target of 1.3220 – 1.3320.
Alternative scenario: Breakout and consolidation of the price above the level of 1.3074 will enable the pair to continue to rise to the level of 1.3220 – 1.3320.
Analysis: Presumably, the formation of the upward impetus in the third wave of the senior level (3) has completed. At the moment, it seems that the large “bearish” correction is being developed as the fourth wave (4). Locally, it is assumed that the zigzag is being formed in the wave А of (4). If this assumption is correct, the pair will continue to decline to the level of 1.2485. Critical level for this scenario is 1.3450. Breakdown of this level will trigger the rise in the pair to the levels of 1.36 – 1.37.

EUR/USD Wave analysis and forecast for  09.10 – 16.10: The decline in the pair is likely to continue.
Estimated pivot point is at a level of 1.1460.
Our opinion: Sell the pair from correction below the level of 1.1460 with the target of 1.0950. In case of breakdown of the level of 1.1460, buy the pair with the target of 1.16 - 1.17.
Alternative scenario: Breakout and consolidation above the level of 1.1460 will enable the pair to continue to rise up to1.16 - 1.17.
Analysis: Presumably, the formation of the correction as the second wave 2 of the senior level continues, within which a double zigzag wxy is being formed. Locally, it is likely that the wave y of 2 is being developed in the shape of a zigzag, within which, the formation of the wave (b) is nearing completion and the decline to the level of 1.0950 is expected in the wave (c). Critical level for this scenario is 1.1460. Breakout of this level will enable the price to continue to rise up to 1.16 - 1.17.
 GBP/USD Wave analysis and forecast for 09.10 – 16.10: The pair is likely to rise.
Estimated pivot point is at a level of 1.5100.
Our opinion: Buy the pair from correction above the level 1.5100 with the target of 1.58 – 1.59.
Alternative scenario: Breakout and consolidation of the price below the level of 1.5100 will enable the pair to continue to decline to 1.4950 – 1.49.
Analysis: Presumably, the formation of the correction of the senior level has completed in the wave В of (2), which has taken a shape of the irregular plane with the diagonal triangle (KDT) in the wave c of B. Locally, it is likely that the one two impetus of the junior level is being developed as the wave (i). If this assumption is correct, the pair will continue to rise in the wave С of (2) to the levels of 1.60 – 1.63. Critical level for this scenario is 1.51.
 USD/CHF Wave analysis and forecast for 09.10 – 16.10: The decline in the pair is likely to continue.
Estimated pivot point is at a level of 0.9840.
Our opinion: Sell the pair below the level of 0.9840 with the target of 0.9130. In case of breakdown of the level of 0.9840, buy with the target of 1.0130.
Alternative scenario: Breakout and consolidation of the price above the level of 0.9840 will enable the pair to rise up to 1.0 – 1.0130.
Analysis: Presumably, the formation of the wave C continues in the second 2 wave of the senior level. Locally, it seems that the correction as the second wave (ii) of the junior level has completed and the wave (iii) is being developed. If this assumption is correct and the price does not break down the critical level of 0.9840, the pair will continue to decline to the level of 0.9130.
 USD/JPY Wave analysis and forecast for 09.10 – 16.10: The pair is likely to decline.
Estimated pivot point is at a level of 120.57.
Our opinion: Sell the pair from correction below the level of 120.57 with the target of 115.00 – 114.00. In case of breakdown of the level of 120.57, buy with the target of 122.00.
Alternative scenario: Breakout and consolidation of the price above the level of 120.57 will make possible the rise in the pair up to the levels of 122.00 – 124.00.
Analysis: Presumably, the formation of the triangle within the wave b of A of (4) of the estimated zigzag has completed. Locally it is likely that the wave с of А is being developed, within which one-two impetus (i) has been formed, as well as the correction in a shape of an irregular triangle (ii) If this assumption is correct and the price does not break down the critical level of 120.57, it is possible that the pair will decline to the level of 115.00.
 USD/СAD Wave analysis and forecast for 09.10 – 16.10: The pair is likely to decline within medium-term correction.
Estimated pivot point is at a level of 1.3450.
Our opinion: Sell the pair from correction below the level of 1.3450 with the target of 1.2485. In case of breakdown of the level of 1.3450, buy the pair with the target of 1.36.
Alternative scenario: Breakout and consolidation of the price above the level 1.3450 will enable the pair to continue to rise to the level of 1.36.
Analysis: Presumably, the formation of the upward impetus in the third wave of the senior level (3) has completed. At the moment, it seems that the large “bearish” correction is being developed as the fourth wave. Locally, it is assumed that the downward impetus in the first wave of the junior level (i) has completed and upward correction (ii) is possible. If this assumption is correct, after the completion of the correction the pair will continue to decline to the level of 1.2485. Critical level for this scenario is 1.3450. Breakdown of this level will trigger the rise in the pair to the levels of 1.36 – 1.37.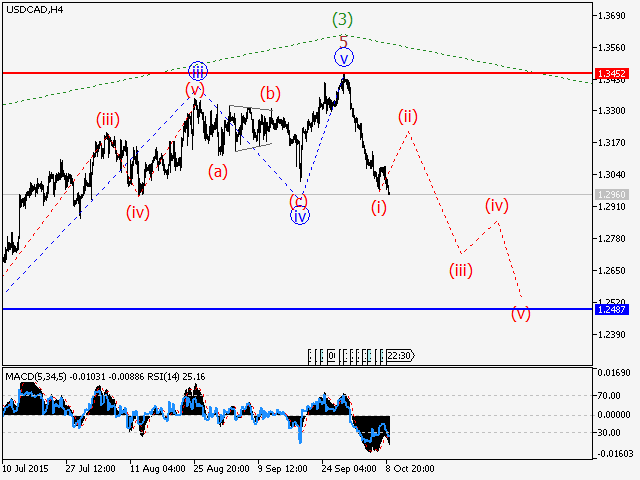

EUR/USD Wave analysis and forecast of 02.10 – 09.10: The pair is likely to decline.
Estimated pivot point is at a level of 1.1280.
Our opinion: Sell the pair from correction below the level of 1.1280 with the target of 1.0950. In case of breakdown of the level of 1.1280 buy the pair with the target of 1.1460 - 1.17.
Alternative scenario: Breakout and consolidation above the level of 1.1280 will enable the pair to continue to rise up to 1.1460 - 1.17.
Analysis: Presumably, the formation of the correction within the second wave 2 of the senior level continues, within which a double zigzag wxy is being formed. Locally, it is likely that the wave y of 2 is being developed in the shape of the zigzag, within which, the decline to the level of 1.0950 is expected. Critical level for this scenario is 1.1280. Breakout of this level will enable the price to continue to rise up to 1.1460 - 1.17.
 GBP/USD Wave analysis and forecast of 02.10 – 09.10: The pair is likely to rise.
Estimated pivot point is at a level of 1.5240.
Our opinion: Buy the pair after the breakdown of the level 1.5240 with the target of 1.58 – 1.59.
Alternative scenario: Breakout and consolidation of the price below the level of 1.5064 will enable the pair to continue to decline to 1.49 – 1.48.
Analysis: Presumably, the formation of the senior level correction is nearing completion in the wave В of (2), which took a shape of the irregular plane with the developing final wave c of B. Locally, it is likely that the formation of the final fifth wave (v) of c of B is nearing completion. If this assumption is correct the price can reverse in the near future and start to rise in the wave С of (2).
 USD/CHF Wave analysis and forecast for 02.10 – 09.10: The decline in the pair is likely to continue.
Estimated pivot point is at a level of 0.9840.
Our opinion: Sell the pair below the level of 0.9840 with the target of 0.9130. In case of breakdown of the level of 0.9840 buy the pair with the target of 1.0130.
Alternative scenario: Breakout and consolidation of the price above the level of 0.9840 will enable the pair to rise up to 1.0 – 1.0130.
Analysis: Presumably, the formation of the wave C continues in the second 2 wave of the senior level. . Locally, it seems that the correction as the second wave (ii) of the junior level has completed. If this assumption is correct and the price does not break down the critical level of 0.9840, the pair will continue to decline to the level of 0.9130 in the third wave (iii) of the estimated diagonal in the wave C.
 USD/JPY Wave analysis and forecast of 02.10 – 09.10: The pair is likely to decline.
Estimated pivot point is at a level of 121.25.
Our opinion: Sell the pair from correction below the level of 121.25 with the target of 115.00 – 114.00. In case of breakdown of the level of 121.25 buy with the target of 124.00.
Alternative scenario: Breakout and consolidation of the price above the level of 121.25 can trigger the rise in the up to the levels of 123.00 – 124.00.
Analysis: Presumably, the formation of the triangle within the wave of A of (4) of the estimated zigzag has completed. Locally it is likely that the one-two impetus as the wave (i) of c has been formed. If this assumption is correct, after the completion of the correction (ii) the pair will continue to decline to the estimated target of 115.00. Critical level for this scenario is 121.25.
 USD/СAD Wave analysis and forecast of for 02.10 – 09.10: The pair is undergoing correction, the rise in the pair is likely to continue.
Estimated pivot point is at a level of 1.3015.
Our opinion: Buy the pair from correction above the level of 1.3015 with the target of 1.3550 – 1.36. In case of breakdown of the level of 1.3015, sell the pair with the target of 1.2480.
Alternative scenario: Breakout and consolidation of the price below the level 1.3015 will enable the pair to continue to decline to the level of 1.2480.
Analysis: Presumably, the formation of the upward impetus in the third wave of the senior level (3) continues. Locally it is likely that the fifth final wave v of 5 of (3) is being developed and within it the first wave (i) has been formed and the correction is being developed (ii). If this assumption is correct, after the completion of the correction, the pair will continue to rise up to 1.3550 – 1.36. Critical level for this scenario is 1.3015. Breakdown of this level will trigger the decline in the pair to the levels of 1.2480.