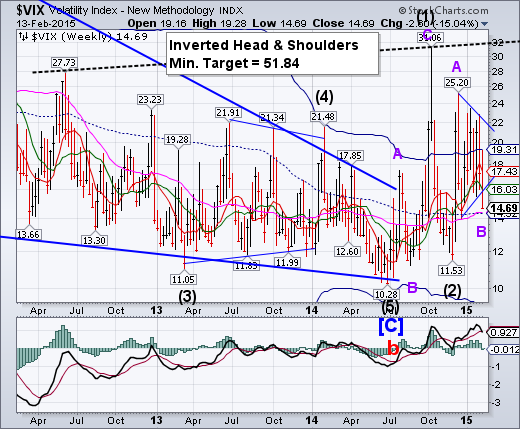
-- VIX completed a Minor degree Triangle formation today, implying a continuation of the direction of Minor Wave A.The Cycles inverted, suggesting the next peak may occur the first week of March. A rally above the Head and Shoulders neckline may get very exciting.
SPX closes at new all-time high.
41
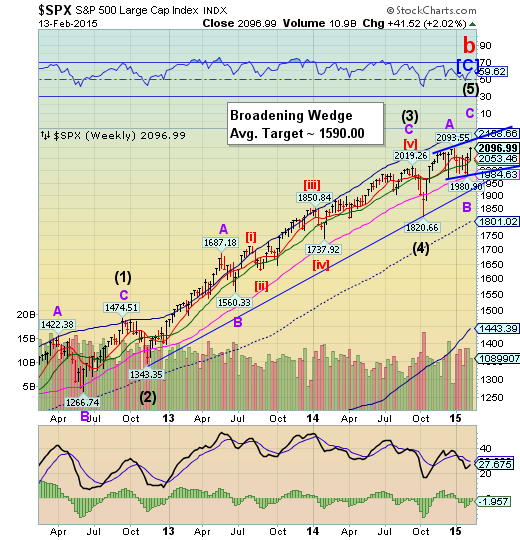
SPX’s test of Long-term support at 1984.63 gave it the impetus to make a new intra-day high at 2097.03. A closer examination of the final rally suggests that it may be complete at today’s close. The inversion of this Cycle from an anticipated low to a high now suggests a new low may occur as early as mid-March.
(USAToday) The Wall Street bull shrugged off fears of Friday the 13th and raced higher, with the S&P 500 stock index setting a new record high and the Dow topping 18,000 for the first time this year.
The Standard & Poor's 500 gained 8.51 points, or 0.4%, to close at an all-time high of 2096.99 beating its previous Dec. 29, 2014 record close of 2090.57.
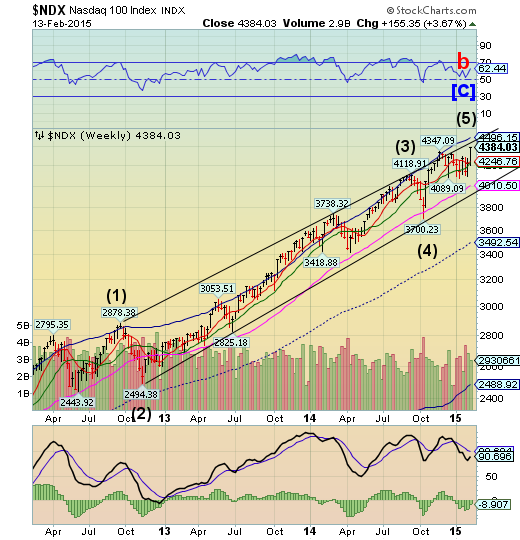
NDX approaches the upper trendline.
NDX closed higher this week as it approached the upper trendline of its trading channel.The new high nullified the bearish cup with handle formation.The next critical support is the weekly Long-term support at 4010.50 and beneath that is the 3-year trading channel trendline. There is a probable 4 weekdecline in this cycle and a lot may happen in that time span.
(ZeroHedge) After six month so soaring confidence, UMich consumer confidence tumbled from 11 year highs by the most since October 2013 in January (despite the low gas price stimulus), printing at 93.6, missing expectations of 98.1 by the most on record. It appears survey-based 'hope' is catching down to hard-date-based reality of spending habits as the sheer idiocy of the low-gas-price meme is destroyed once again. The drop was led by a plunge in Current Conditions from 109.3 to 103.1 and towards the future, fewer now expect higher incomes and those who have favorable business expectations plunged from 70 to 58 with a surge in people expecting "bad times" over the next 12 months.
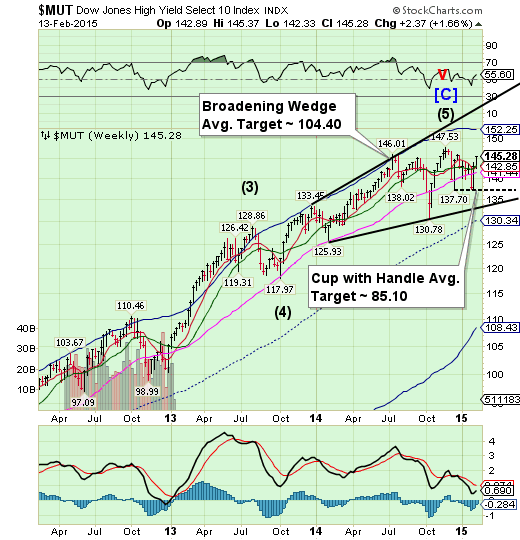
High Yield bearish patterns change.
The High Yield Index appears to have shrugged off its Diamond Formation but retained its Broadening Wedge and Cup with Handle formations. What originally appeared as a potential Cycle low became inverted to a cycle high this week. The upside pattern appears complete, so a reversal may be imminent. The mainstream press has no idea what might be coming…
(Reuters) Investor appetite for US junk bonds has rebounded strongly in the past few weeks, as stronger oil prices and better liquidity have helped draw billions of dollars back into the asset class.
That in turn has narrowed the gap between cash prices of high-yield bonds and the cost of protection on those bonds to just 30bp, according to Barclays.
That's in sharply from an 80bp level in mid-December, only a few weeks ago, as the buy-side sees less to fret about in lower-rated debt offerings.
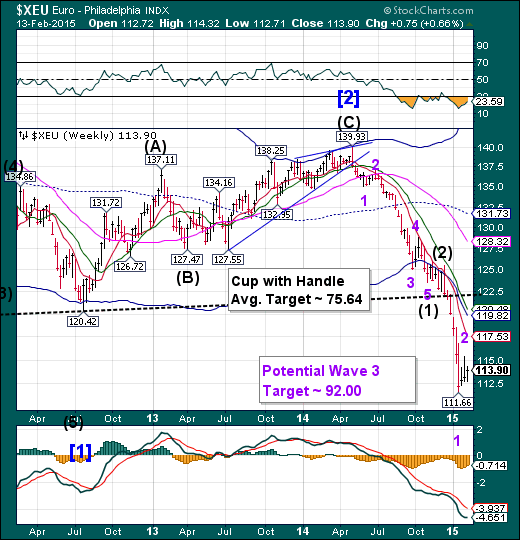
The euro appears ready to resume the downside.
The euro bounce appears to be over. It anticipate sits next Master Cycle low (Wave 3) in mid-March, which may produce quite a fall. The discussion now is, how far below parity will the euro go?
(ContraCorner) Now and again history reaches an inflection point. Statesman and mere politicians, as the case may be, find themselves confronted with fraught circumstances and stark choices. February 2015 is one such moment.
For its part, Greece stands at a fork in the road. Syriza can move aggressively to recover Greece’s democratic sovereignty or it can desperately cling to the faltering currency and financial machinery of the euro zone. But it can’t do both.
So by the time the current onerous bailout agreement expires at month end, Greece must have repudiated its “bailout debt” and be on the off-ramp from the euro. Otherwise, it will have no hope of economic recovery or restoration of self-governance, and Syriza will have betrayed its mandate.
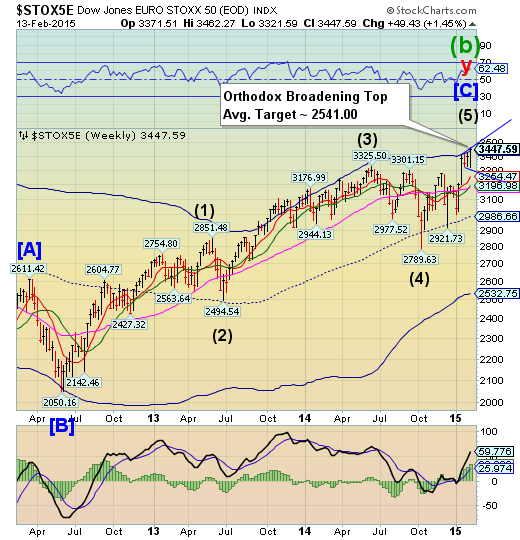
EuroStoxx makes its final run to its Broadening Top.
The EuroStoxx 50 Index appears to have completed the final upward probe of an Orthodox Broadening Top. The Cycles Model now suggests the next low may come late February to early March..
(ZeroHedge) Because "bad is good" in the new normal central-planner-created fiction in which we live...
Despite today's surprise in GDP, 2015 growth expectations remain dismal... but when did that ever stop anyone?
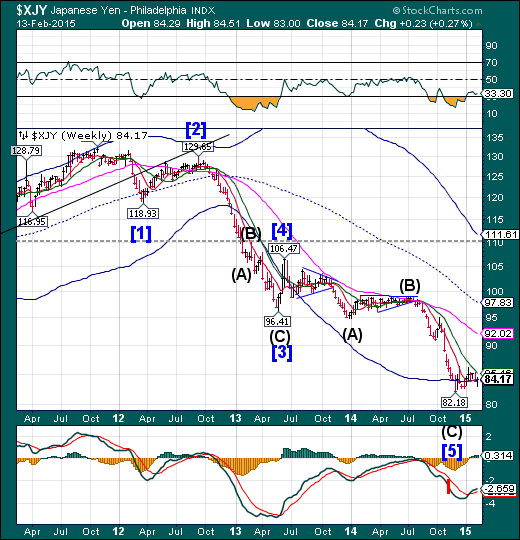
The yen is still lingering at the bottom.
The yen continues to linger near its Cycle Bottom at 84.05. It has yet to overcome its December 16 high at 86.34. Once the breakout occurs, the yen may gain momentum in its rally, since most traders have not recognized a change of trend…yet.
(WSJ) Betting against the yen isn’t the layup it once was.
One of Wall Street’s most popular and lucrative trades in recent years has gone flat in 2015, the victim of its own success and renewed concerns that Japanese officials may not see through a radical overhaul of monetary and economic policy.
The sentiment shift has wrong-footed many traders, prompted others to close out their wagers and sown seeds of doubt among those still betting that Japan’s efforts to jump-start a stagnant economy will send the yen lower still.
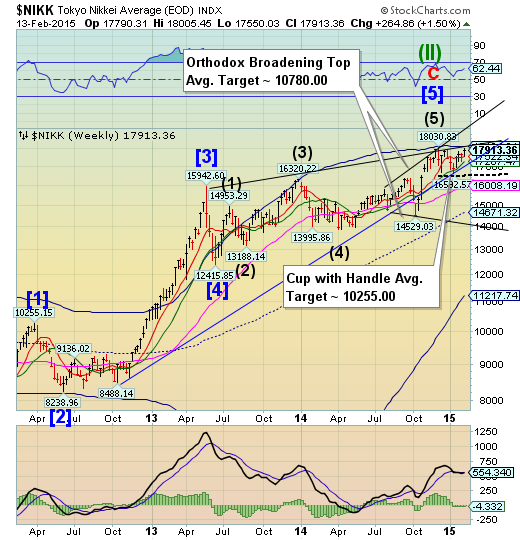
The Nikkei was positive, still no new highs.
The Nikkei again failed to make a new high this week andthus retained its bearish formations. The attempted rally has produced a new chart pattern that suggests a possible waterfall event in the making. The Orthodox Broadening Top agrees with that outcome, since it represents a market that is out of control and has a highly emotional public participation. This may be the start of a dramatic decline that is imminently due.
(Bloomberg) -- Predictions the Nikkei 225 Stock Average will reach 20,000 by December spells another bumper year of share sales for Bank of America Corp.
The nation’s second-biggest underwriter among wholly-owned overseas banks of equity offerings in 2014 says some Japanese company owners may look to cash in, having ridden a market whose returns have more than doubled since the end of 2011.
“We may see more corporate sponsors who bought shares at a cheaper level selling to take profits,” Reiko Hayashi, the Charlotte, North Carolina-based bank’s head of Japan global capital markets, said in a Feb. 2 interview. “I wouldn’t be surprised to see some people push ahead with share sales if the market moves up to between 18,000 and 20,000.”
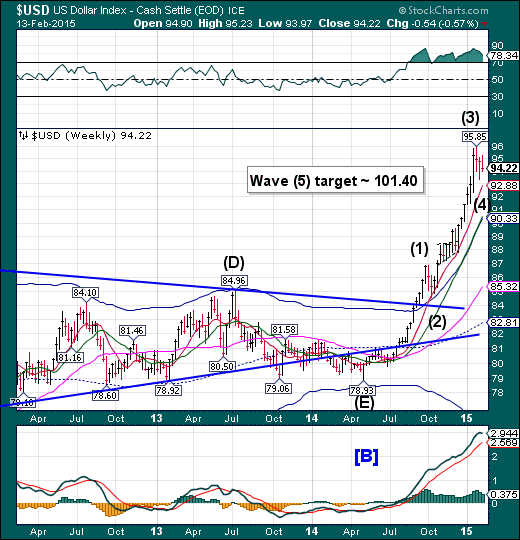
U.S. dollar may be extending its retracement.
The US dollar may be extending its retracement through early March. The Cycles Model may be calling for a deeper Wave (4). Typically a retracement will fall back on some support level. It may test Intermediate term support at 90.33, for example.
(Reuters) - The dollar dropped across the board on Thursday after weaker-than-expected U.S. economic data, although its outlook remained upbeat as many investors continued to price in an interest rate hike by the Federal Reserve sometime this year.
The dollar index, a gauge of its value against six major currencies, fell after two straight days of gains. For the month of February, the dollar index was down 0.5 percent, on track for its first monthly loss in eight months.
U.S. retail sales fell 0.8 percent last month, while jobless claims rose above 300,000 in the latest week.
"We're seeing a bit of a bump in the road for the dollar with retail sales being a miss compared with expectations and jobless claims being higher," said Lennon Sweeting, corporate dealer at U.S. Forex in Toronto.
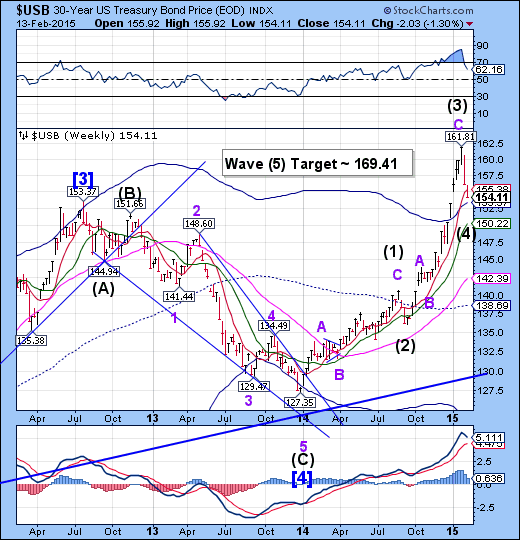
USB nearing the end of its retracement.
The Long Bond appears to be completing its Wave (4) retracement at its Cycle Top support at 153.37. For the last two weeks liquidity has been rotating out of bonds and into stocks and commodities as the Cycle inverted. However, the flow may reverse back into bonds as stocks and commodities complete their topping process.
(WSJ) U.S. government bonds fell Friday, capping their biggest two-week selloff in more than 1½ years as worries over the global economic outlook abated.
Investors’ appetite for risky assets, such as stocks, revved up, while demand for the relative safety of Treasurys fizzled. Money managers took comfort from data released Friday that showed accelerating growth in the eurozone, led by Germany, in the fourth quarter. Sentiment also was boosted by hopes that Greece and its international creditors would find a solution to avert a default by the country.
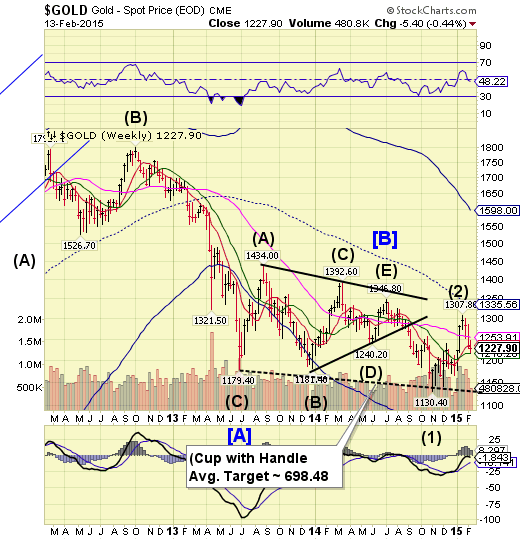
Gold is caught between support and resistance.
Gold bounced off Intermediate-term support at 1216.26, but closed beneath Short-term support at 1235.90.It may bounce further early next week, but should resume its decline by mid-week. Shortly thereafter, it may decline through the Lip of its Cup with handle formation.
(CNBC) Gold rose one percent on Friday, erasing a week of losses, as the dollar dropped on weaker than expected U.S. economic data.
Spot gold rose to a session high of $1,234.60 an ounce and was up 0.5 percent at $1,228 an ounce.
U.S. gold for April delivery edged up $9 at $1,229 an ounce. The United States is on a national holiday on Monday.
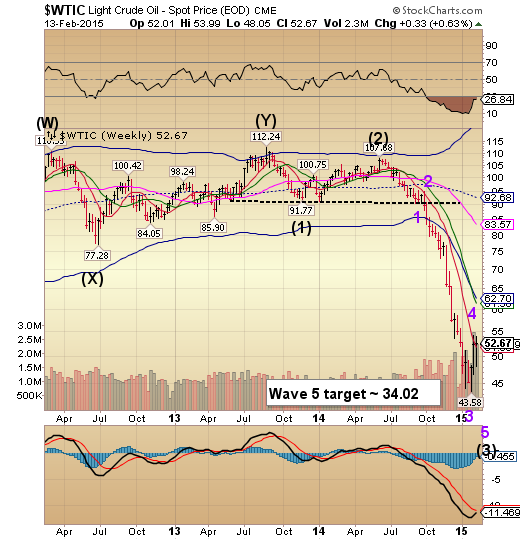
Crude may spend another week or two in consolidation.
Crude appears to be in a Triangle formation that may require another week or two to finish the consolidation. It may either rally a bit more to its weekly Cycle Bottom resistance currently at 61.90 or wait for resistance to decline toward it, or some combination of the two. This may allow the weaker (short) hands to be shaken out some more.
(MarketWatch)—U.S. crude-oil futures on Friday scored a third straight weekly gain, with prices for the Brent contract marking their highest settlement of the year on the back of spending cuts by oil companies and further declines in the number of active U.S. oil rigs.
On the New York Mercantile Exchange, crude for delivery in March CLH5, +2.81% rose $1.57, or 3.1%, to settle at $52.78 a barrel—up about 2.1% for the week.
Shanghai Index closes beneath Short-term support.
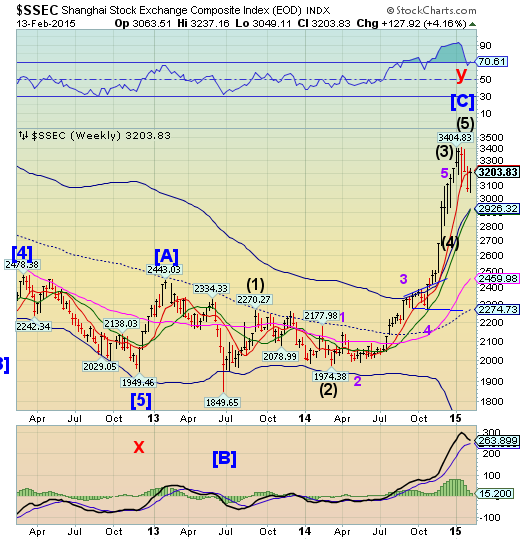
The Shanghai Index fell beneath Short-term support at 3222.74 last week and could not close above it this week. The Shanghai Index appears to be on a sell signal and may be in a panic decline for the next three weeks. The decline may go to weekly Long-term support at 2459.98 or possibly mid-Cycle support at 2274.73 by early March. Volatility is on the rise in China, despite massive liquidity injections.
(ZeroHedge) Following the previously reported collapse of Chinese trade, the Politburo had to find a way to keep the economy humming internally, since it couldn't rely on outside growth stimuli. As a result it did precisely what it has done every time in the past decade when it finds itself in a growth crunch: flood the economy with new loans, which just happens to be the main threat facing the Chinese economy, which as we have describe time and again, is now toiling under trillions in under-reported and underestimated non-performing loans.
As the PBOC reported overnight, in January, Chinese new loan creation soared to RMB 1,470 billion, more than double the RMB 697 billion in December, and blowing estimated out of the water. This was also a 14% surge from a year ago, and most disturbing, the highest new loan creation month since the emergency interventions during the Lehman collapse!
The Banking Index rallies, but still bearish.
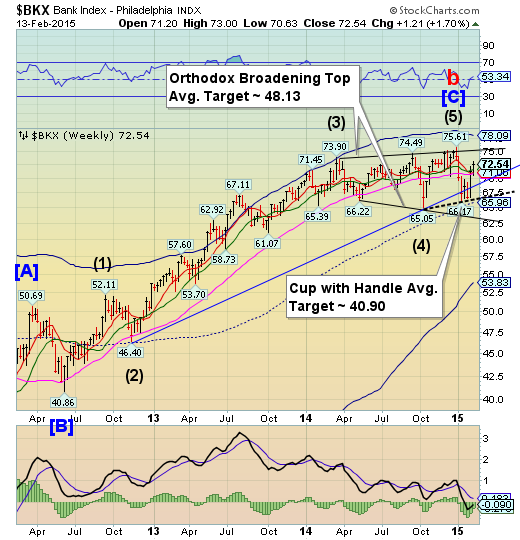
--BKX extended its retracement rally this week, but couldn’t change its bearish outlook. This is the index that will lead equities and commodities in their next decline. The Cycles Model now implies that there may be a 3 week decline ahead. Could this be a waterfall event?
(ZeroHedge) It would appear the un-sourced rumors of Greek banks having used up their Emergency line of credit with the ECB are true. Following a hastily put together conference calls this morning:
*ECB RAISES GREECE ELA ALLOWANCE TO EU65BN: FAZ
Up from the previous EUR 59.5 Billion. It appears the stealth bank run in Greece is showing no signs of slowing.
(ZeroHedge) You know it's bad when... you start blaming speculators. Very reminiscent of the "it's not us, we have a solid balance sheet, it's the short selling speculators" bullshit in the days before and after the stock crashes of American Insurance Group, Bear Stearns, Lehman Brothers and Merrill Lynch; mere days after his bank's bonds crashed, the CEO of RaiffeissenBank (Austria's 3rd largest) has stated (unequivocally) that "panic was created artificially," blaming short-sellers for his bank's demise.
(TheHill) Sen. Elizabeth Warren (D-Mass.) maintained Thursday that the 2010 Dodd-Frank Wall Street reform law has helped community banks do better than big banks.
Warren made the claim at a Senate Banking Committee hearing on community banking regulations, during which she also chided Daniel Blanton, chairman-elect of the American Bankers Association (ABA), who testified.
Blanton and community banking officials have pushed for exemptions from certain parts of Dodd-Frank, such as mortgage-lending requirements, that they argue should only be applied to big banks.
(ZeroHedge) Over the past two years we explained how in a time of ubiquitous central bank debt monetization, the amount of global sovereign bonds available for purchase - when taking into account CB purchases - has been declining at an ever faster pace, leading to a collapse in liquidity (something the TBAC warned about in the summer of 2013, leading to the Fed's taper and subsequent temporary halt of QE3), and - naturally - to soaring bond prices (and plunging yields). The latter has reached epic proportions recently, and resulted in $3.6 trillion in global government debt, 16% of total, that is now trading at negative yields.

No comments:
Post a Comment